The Solvency II Wire Quarterly is a general update on the state of Solvency II implementation as reflected in the Solvency II Wire Regular Meeting Groups (RMGs) and other Solvency II Wire activity. The RMG brings together a wide range of practitioners to discuss Solvency II and related matters. The following is a summary of the key discussion topics addressed at the meeting.
In this issue

1. Introduction: changing times
The Solvency II Wire Quarterly usually begins with an analysis of the latest Solvency II Barometer scores. However, given the extraordinary events of the final quarter of 2016 and the election of Donald Trump, I want to start this volume by stating openly and categorically that I personally, and Solvency II Wire as a publication, cannot accept the racism, misogyny and bigotry that Mr Trump touted throughout his campaign. There is a real risk that such attitudes become accepted when the tone is set at the top and run the danger of becoming normalised, a type of negative BAU.
#resist
Regardless of what you think of his politics, these messages of intolerance and aggression are not ok. And President Trump must be held accountable for them. The Women’s Marches held across the globe after the inauguration are a welcome start. Equally disturbing and dangerous is the Trump administration’s attack on the press. The strategy is deceptively simple: undermine all credible sources until there are none, creating a destabilised reality, where the president can operate unhindered by pesky “facts”. Its authoritarianism through the back door, a sort of perverse reverse-gold-plating of democratic principles. The rise of fake news, proliferated by corporate social media platforms that refuse to take responsibility for what they publish, has been promoted to an official status with the introduction of “alternative facts”. Together with the attempts to shut out the press these are the next escalations in the battle.
The era of politics
The political changes in the US and Europe usher in an era of contradictions and uncertainty. The US is turning inwards, and all signals are that it will pursue a protectionist trade agenda, while a post-Brexit UK is pinning all its hopes on an open trade policy with the rest of the world. For Europe, it is as yet unclear if the continent will close ranks or fragment in response to these events. The changes also signal the end of the era of regulation, as we know it. If most of the decade following the financial crisis was a dominated by regulation – stitching back together a quarter of a century of deregulation – the tide is turning again. For firms plotting their path into the future, it is politics, rather than regulation, that will make the most difference. The big decisions are becoming less about tinkering with calibrations and capital charges, and much more about big bold economic, demographic and societal challenges.
Change

But changing regulatory decision-making is not enough. Business and government must also learn the lessons of austerity and accept that it accelerated the inequalities that delivered the Brexit vote in the UK and has done much to undermine European unity. Ten years of austerity have got us here. Until a credible solution is offered to tackle inequality the outlook will remain bleak. Business, politicians and society must begin to accept again that this will require a better relationship between companies and their employees that more equally distribute the firm’s profits. Until that balance is redressed an era of autocratic false prophets is likely to continue.
2. Solvency II Barometer
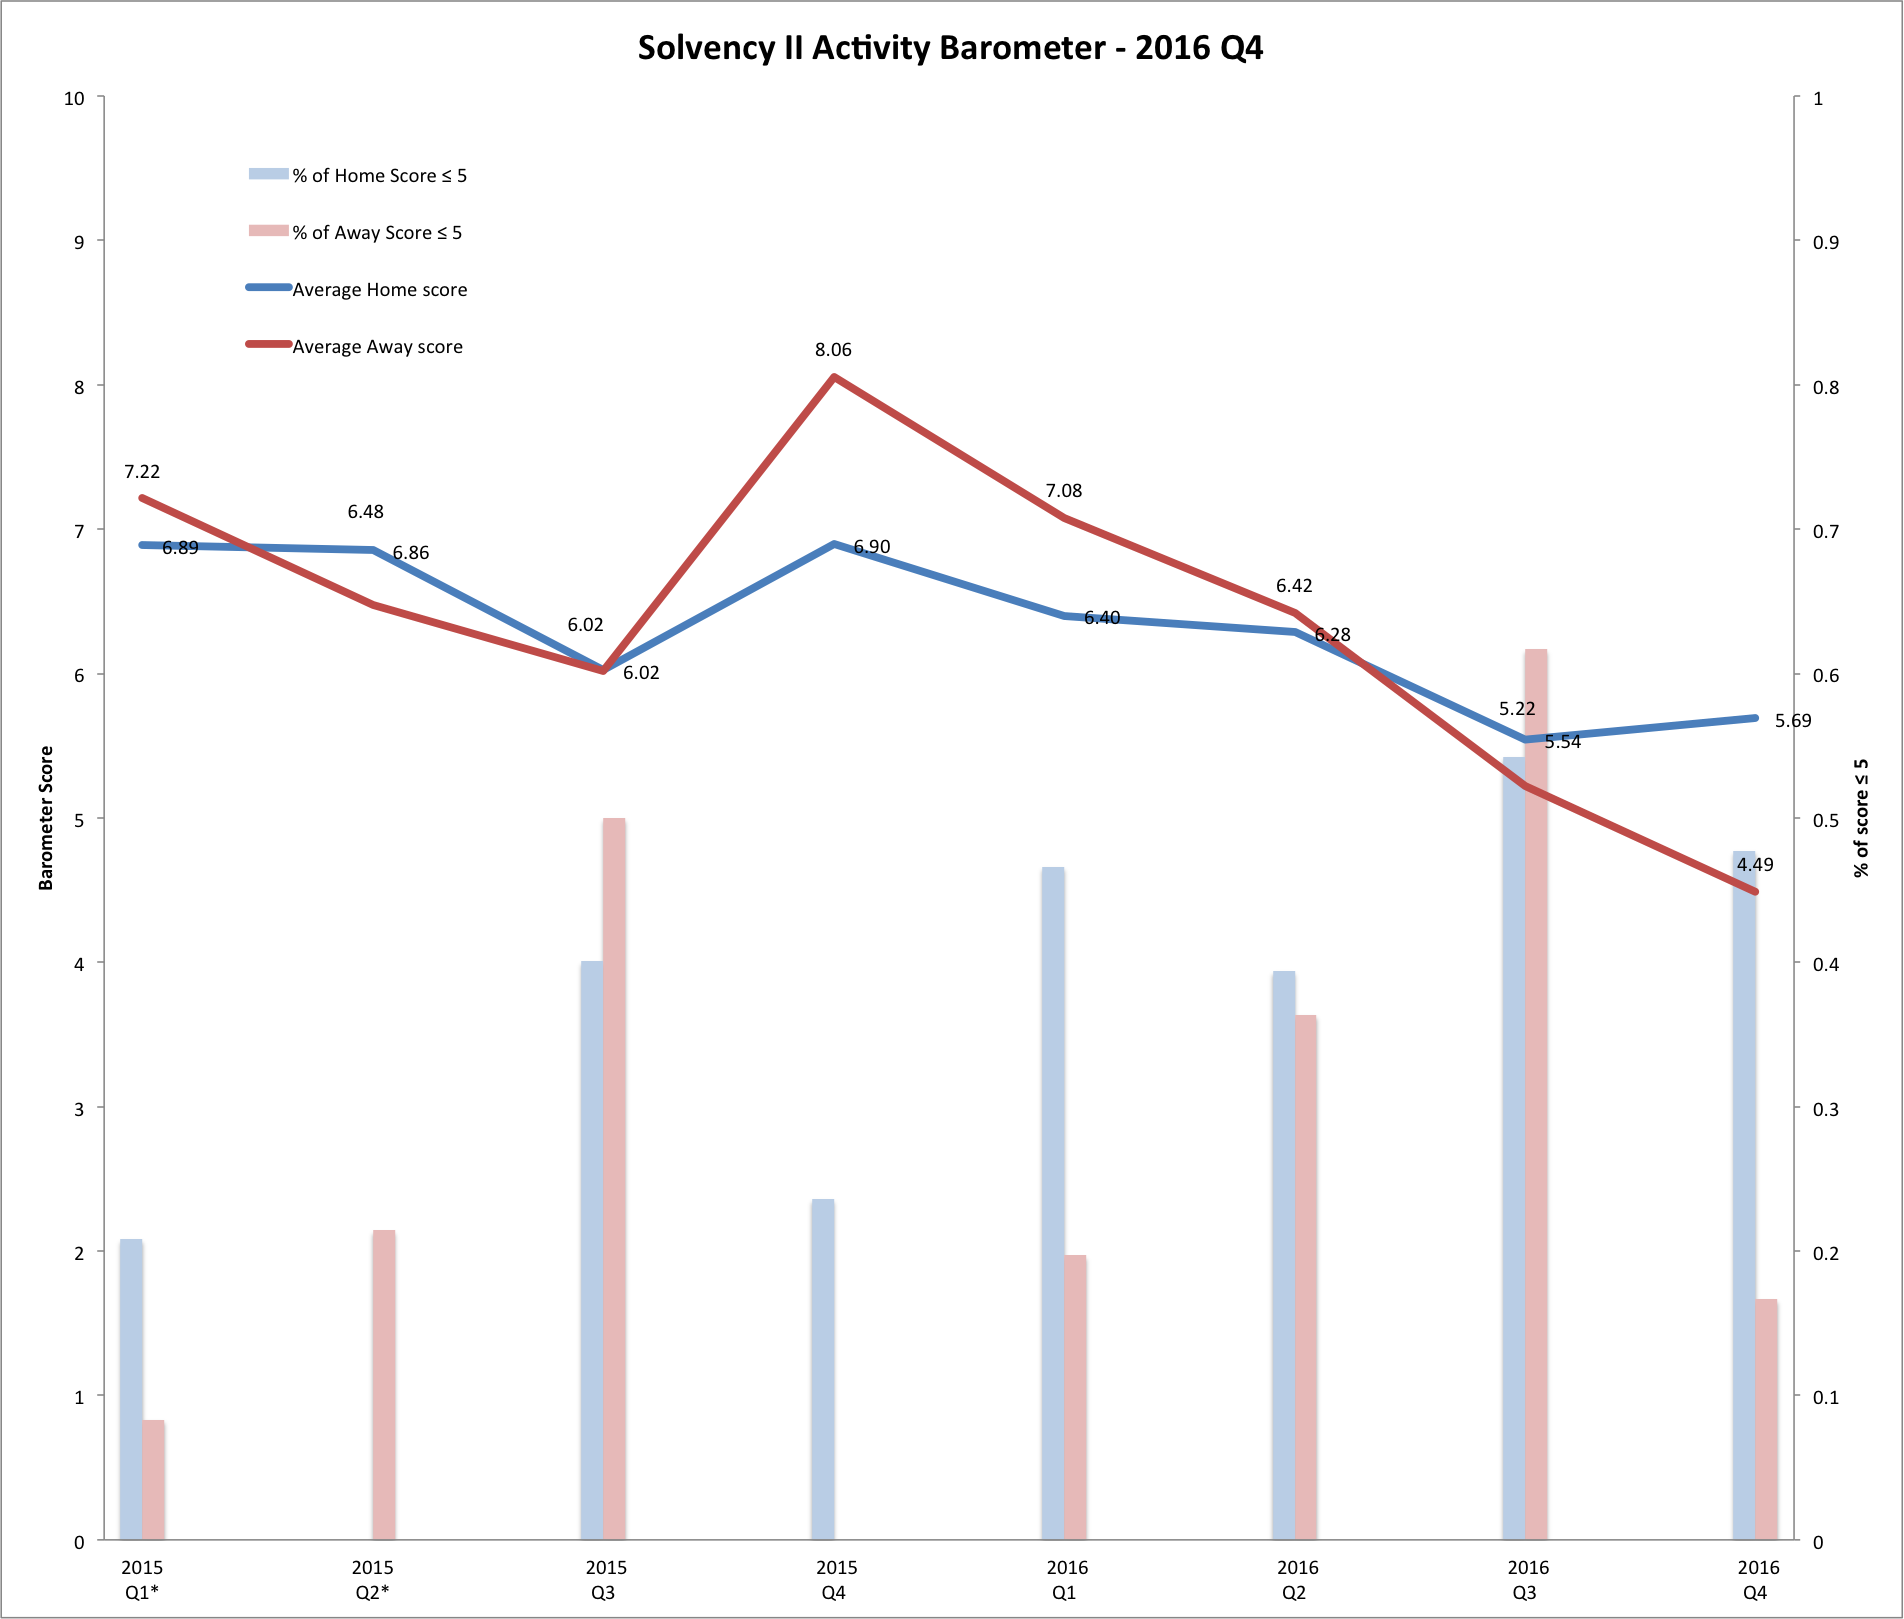

Participants in the Solvency II Wire Regular Meeting Groups (RMGs) are asked to rank the level of Solvency II activity in their own work (Home score) and that of their organisation or the market, as they see it (Away score). The score is on a scale of 1-10, where 10 represents 100% of the time spent on Solvency II. The chart shows a continued downward trend of Solvency II activity for the whole market (away score), although overall the portion of away scores ≤5 has dropped significantly over the quarter. The uptick in the home scores, marking an increased activity for individuals attending the meetings, echos the trend for the same period last year and is most likely a result of increased reporting work on the first Solvency II annual reporting and the public disclosures.
3. Report
Solvency II entered into force at the start of 2016 with little fanfare outside of the insurance world. The few articles peppered across the mainstream press (with various degrees of understanding of the topic) focused on the familiar themes: capital charges, M&A activity and the burden of regulation. There was little focus on some of the more important benefits of Solvency II such as improved governance, the unrestricted investment options and the fact that insurers have to take a more realistic view of their solvency position in relation to their business model and the risks they face.
Solvency II public disclosures
The fourth quarter of 2016 saw accelerated preparation activities for the first round of Solvency II annual reporting and public disclosures (20 May 2017 solo firms and 01 July 2017 for groups, YE31 December). The public disclosures include a narrative report (Solvency and Financial Condition report – SFCR) and a set of quantitative templates (Quantitative Reporting Templates – QRTs). While the QRTs consist of prescriptive templates, the rules only specify the structure of the SFCR and what kind of information has to be disclosed. It is up to each firm to decide what and how much to disclose. A number of SFCR reports have already been published (see analysis here). The November RMG was dedicated entirely to the subject of disclosures. A number of challenges emerged.
Depth of disclosure
The Solvency II ITS (2015/2452) relating to the SFCR only specifies the parts and subheadings of the report (they are all mandatory): Business and Performance, System of Governance, Risk Profile, Valuation for Solvency Purposes and Capital Management. Guidance on the type of information that should be included in each section is provided in the annexes of the ITS and by EIOPA, but that is about it. EIOPA also published a handy guide with suggestions of which QRTs could be included in specific sections of the SFCR. The extensive discretion given to firms is leading to what is perhaps the biggest challenge of the Solvency II reporting and disclosures: balancing the amount of information to disclose. Too much information could be used by competitors, while disclosing too little information compared to peers could raise questions by stakeholders and market participants such as investors and analysts. Insurers described a variety of strategies for managing the disclosures. One strategy involves disclosing as little as possible, with a view to adapting the information at a later date. Others are embracing the opportunity and appear to be treating the SFCR as a marketing prospectus almost. One participant noted that they were aware that some insurers were considering using voluntary audit-type exercises to understand if they are covering the adequate topics at the right depth.
Education, education, education
Alongside managing the new levels of disclosure, many firms are beginning to engage in educating stakeholders about the new information. Listed firms are targeting analysts and institutional investors on specific aspects of Solvency II, which may distort results for their business compared to other insurers. How analysts will interpret the LTG package figures is central to this understanding. Over the coming years it is expected that market standardization will begin to take place. It is however possible that this may vary across countries depending on the levels of use of the LTG. Countries to watch include Germany, the UK and the Netherlands.
Information gathering, production and cost
The disclosures have also increased the burden of gathering information. Some insurers and asset managers noted that collecting the relevant information for the annual QRTs was still proving a challenge. Insurers are also looking at ways of making the process more efficient by reducing duplication. For example, work on disclosures is taking place alongside the preparation of the private Regular Supervisory Report (RSR) to the supervisor. Some firms are taking a joint approach to the RSR and SFCR, trying to produce a single document from which the SFCR can be derived. But one insurer who tried this said it was proving to be too difficult and they had decided to treat the two documents separately.
Narrative and consistency of message
As the SFCR is a new report, firms must also ensure consistency of messaging with existing disclosures (e.g. year-end press release) for both Solvency II and non-Solvency II. Producing a coherent and effective narrative across all public disclosures will be needed to explain the differences between accounting figures as well as the impact of the LTG (if used) and the fact that Solvency II makes explicit volatility that was previously hidden.
Model change and SCR review

On 21 September 2016 the PRA published a consultation paper on model change for Internal Model firms. A number of challenges associated with model change approval were discussed at the October RMG. One of these is the approval frequency and timeliness of the application. It was noted that even if an application has been made for model change, reporting has to be based on the current model until the change has been approved. Model change approval is likely to be resource intensive and require multiple levels of sign-off that may slow down the process compared to current model change process. It was also noted that evidencing that the model changes have been made neutrally may prove challenging. Overall concern was expressed that overly prescriptive requirements on Internal Models will render them less effective for the firm. As one participant noted: “It is difficult to work with a model you don’t trust.” SCR appropriateness In the discussion about the appropriateness of the SCR it was noted that validating Internal Model SCR appropriateness against standard formula results and other proxies might be misleading. One participant expressed a view that supervisors and EIOPA have been overly concerned about model ‘gaming’ and ‘cherry-picking’, in part driven by the failures of market risk models in the banking sector. This has led to an over-engineering of the requirements for approval of models and even of undertaking-specific parameters. The decision to require comparison of internal model and standard formula SCRs should have been an opportunity to loosen the requirements in relation to model change.
4. Solvency II Wire Data Analysis
EIOPA released the first set of initial aggregate Solvency II figures based on the 2016 Stress Test and the report on long-term guarantees measures. Information from Solvency II Wire Data about a number of individual firms that have published voluntary Solvency II figures in 2016 sheds light on the impact of Solvency II on specific firms.
SCR ratio volatility
The following chart shows the change in SCR ratio for 22 firms between 31 December 2015 to 30 September 2016 (with reference point on 30 June). [gview file=”https://www.solvencyiiwire.com/wp-content/uploads/2017/02/Hi-low-chart-2016Q4.pdf”]
The EIOPA stress test examined figures for a sample of 236 solo firms writing long-term business (mostly life and composite) as of 1 January 2016. The average SCR ratio for the sample was 196%. Although many of the firms in the Solvency II Wire Data sample are groups, this provides a useful reference point for understanding the data.
On 31 December 2015 the ratios ranged between 93.8% (Gjensidige Pensjonsforsikring, NO) to 302% (Munich Re, DE), a difference of 208.2%, with an average ratio of 173%.
On 30 September 2016 the ratios for the sample ranged between 110% (Qudos Insurance, DK) to 250% (Munich Re, DE), a difference of 140% with an average ratio of 174%.
The percentage change in the SCR ratio over the period ranged between an increase of 41% (Tryg, DK) and a decrease of -17% (Munich Re, DE). The average change for the sample was an increase of 3%. 14 firms experienced less than ±10% change in the SCR ratio over the period.
Despite the wider range of ratios at the start of the year (208.2%), the average for the sample remained relatively unchanged over the period. Of the 8 firms that experienced a change greater than ±10%, 3 experienced a significant change in the ratio of more than ±20%.
The ratio changes for a similar sample of firms was examined for the first half of 2016, exhibiting a similar distribution of volatility. The change over the period for the sample was -3%, with 6 out of 28 firms exhibiting more than ±10% change in the ratio over the period.
4 firms in focus
Some of the patterns and drivers of the SCR ratio change can be understood by looking at the ratio fluctuations of individual firms. The following chart tracks the ratios of 4 firms across the first three quarters of 2016.
[gview file=”https://www.solvencyiiwire.com/wp-content/uploads/2017/02/SCR-ratios-Quarterly-Charts-Q4-V2.pdf”]
The Delta Lloyd ratio increased by 19% (from 131% at the start of the year to 156% by the third quarter); Ethias experienced a reduction of -12% over the period, from 131% to 115%; RSA experienced a 6% increase over the period, from 143% to 151%; and Tryg experienced a 41% increase over the period, from 154% to 217%.
Q on Q change
The following chart shows the percentage of ratio change from quarter to quarter and gives an indication of the volatility of the ratio over time.
[gview file=”https://www.solvencyiiwire.com/wp-content/uploads/2017/02/Q-on-Q-Quarterly-Charts-Q4-V2.pdf”]
Overall the first and second quarters of the year were somewhat more volatile compared to the changes in the third quarter. The volatility is both for increases and reductions in the ratios. For example, Tryg experienced a 38% increase in the first quarter, while Ethias experienced an 18% drop for the same period.
Ethias
The Ethias ratio dropped 12% over the period, however it exhibited high volatility, starting the year at 131.56%, dropping 16% in the first quarter, rising 13% in the second quarter and then dropping 8% in the third quarter, ending at 115.69%.
The figures are calculated using a standard formula without the use of transitionals.
The company cited an “important decrease in interest rates”* as the main cause of the ratio deterioration in each quarter.
(* To access the text select the data point on the chart – registration needed)
In Q2 it noted: “Strengthening of our SII margin in 2016 through the technical result of the non-life business (between EUR 200M and EUR 300M over the last 3 years) and the implementation of structural measures included in the plan to be submitted to the NBB for end of November.”
Later in the year the company took special action to help improve and stabilise its Solvency II ratio: “Given the highly tense situation that persists on the financial markets and the entry into force of the European Solvency II regulation on 1 January 2016, Ethias offered – from 7 November to 9 December 2016 – the holders of a FIRST Account concluded before September 2003 (“first generation” contracts) an exit premium of 25 % upon termination of their contract, and this in order to strengthen its Solvency II ratio.”
The company estimates this will increase the Solvency II ratio by 22% in the fourth quarter.
RSA
The RSA ratio increased by 6% for the period. The ratio increased steadily by 5% and 6% over the first two quarters up to 158% (143% in December 2015) and dropped by 4% in the third quarter.
The uptick in the first two quarters was due to increased profitability and favourable foreign exchange movements. In Q2 the company listed a number of factors that affected the ratio in the first half of the year as follows:
“• Restructuring costs and other non-operating/non-recurring charges reduced the ratio by 5points;
- Pull-to-par on unrealised bond gains accounted for a 4 point reduction;
• 12 points of benefit from the Latin American and Russian disposals, completed in the period; - Market movements added 5 points of coverage, mainly driven by positive foreign exchange movements. RSA has low exposure to yield movements due to matching of assets and liabilities. Equities and credit spreads were broadly flat over the period;
- Pension movements and the interim dividend reduced the coverage ratio by 2 points and 3 points respectively.”
The Q3 downward movement was dominated by the post Brexit environment, with some uptick driven by “profits, FX and other mark-to-market values”.
Delta Lloyd
The Delta Lloyd ratio rose by 19% over the period, dominated by a large increase of 36% in the second quarter. The ratio dropped by 3% and 10% in the first and third quarters respectively.
The figures presented are based on a standard formula without the use of transitionals.
The increase in the second quarter was driven almost entirely by a EUR 650M rights issue and “management actions including the sale of our shareholding in Van Lanschot”.
The adverse impact on the ratio was mostly due to market conditions, part of which were mitigated by company action: “Market movements had a c. 10% points negative impact on the SF ratio. The latter was partly mitigated by realised management actions, with a positive effect on the SF ratio of c. 6% points”.
Tryg
The Tryg ratio increased by 41% over the period. The most significant increase occurred in the first quarter 38%, followed by a 3% decrease in the second quarter and a 5% increase in the third quarter.
Tryg uses a partial internal model.
Part of the increase in the first quarter is explained by the shift in capital calculation from Solvency I to Solvency II; the company restated its 31 December 2015 figures on 1 January 2016 (so called “Day 1” figures), which was not the case for the other 3 firms (see 2016 Q1 data point).
The Tryg Day 1 ratio is 176%. However, even with this change, the ratio exhibits a significant increase of 20% during the first quarter. The two largest factors affecting the increase were a reduction in the SCR due to deferred taxes and an increase in own funds from expected future profits.
Analysis
The two main drivers of SCR ratio change were market conditions and company actions. Of the two, company action was by far more significant in influencing the change. The findings raise a number of questions for the validity and analysis of the Solvency II figures. In particular it remains to be seen if the influence of company actions will continue over time or if these will become more subdued once the initial adjustment to Solvency II is complete.
The Solvency II Wire Quarterly is a new initiative and we would be very keen to get your feedback on this new initiative. Click here to email the editor directly.
To subscribe to the Solvency II Wire mailing list for free click here.
About Solvency II Wire Data
Solvency II Wire Data is a simple and powerful tool for analysis of all available Solvency II public disclosures across Europe from Solvency II Wire.
The tool provides detailed information about the Solvency II figures, enabling you to build reports and view changes over time to better understand the impact of Solvency II.
Solvency II Wire Data builds on Solvency II Wire’s unsurpassed market leading reporting and understanding of Solvency II across Europe. We now bring the same level of clarity and reliability to the Solvency II figures to help you make the most of the data.
To learn more about Solvency II Wire Data, click here.