|
ANALYSIS |
Alternatives are a hot-topic asset at the moment and hopes are still pinned on the insurance industry making massive forays into this asset class to provide investment in the real economy. In this note we look through to exposure of Nordic insurers to alternative asset classes.
EIOPA recently published aggregate quarterly statistics based on the Solvency II private disclosures. The chart below shows the asset allocation for the five Nordic countries and the EEA as of Q2 2017. The insurance industry holds just over EUR 11 trillion in assets under management.
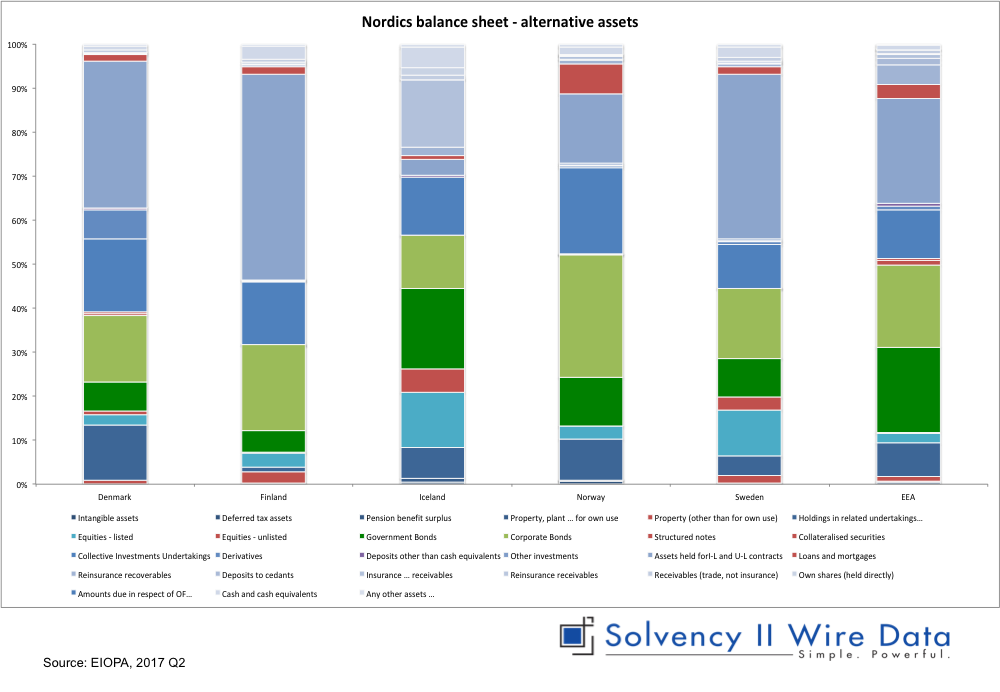
The figures show that proporionatly, Nordic insurers hold fewer government bonds in their portfolio relative to the EEA, but similar amount of corporate bonds. Other notable asset classes in the region include: Assets held for Unit and Index linked (light blue), Collective investments and Holdings in related undertakings. There is also higher allocation to equities in Iceland and Sweden.
Alternative exposure
For the purpose of this analysis the following items on the balance sheet (highlighted in red) have been classified as alternative: Property (other than for own use), Equities – unlisted, Structured notes, Collateralised securities, Other investments, Loans and mortgages to individuals, Other loans and mortgages and Receivables (trade, not insurance).
While the Solvency II balance sheet does not provide a breakdown based on a more traditional distinction of alternative assets, e.g. hedge funds, infrastructure etc., the figures give some indication of other asset classes that fit the criteria.
Despite the lack of granularity the figures still provide a reasonable indication of the type, and more importantly appetite, to invest in alternatives in the Nordics.
Both Denmark and Finland exhibit similar exposures to alternative assets, 4% and 5% respectively. In absolute amounts the portfolios are quite different: EUR 18 billion Danish alternatives compared to only EUR 4 billion in Finland.
Iceland, Norway and Sweden all have about 7% exposure to alternatives despite considerable differences in the size of the national balance sheet, with Sweden’s EUR 22 billion overshadowing Norway’s EUR13 billion and dwarfing Iceland’s EUR 0.8 million.
Nordic exposure
The following chart looks through into the same distribution for individual solo companies across the Nordic five countries.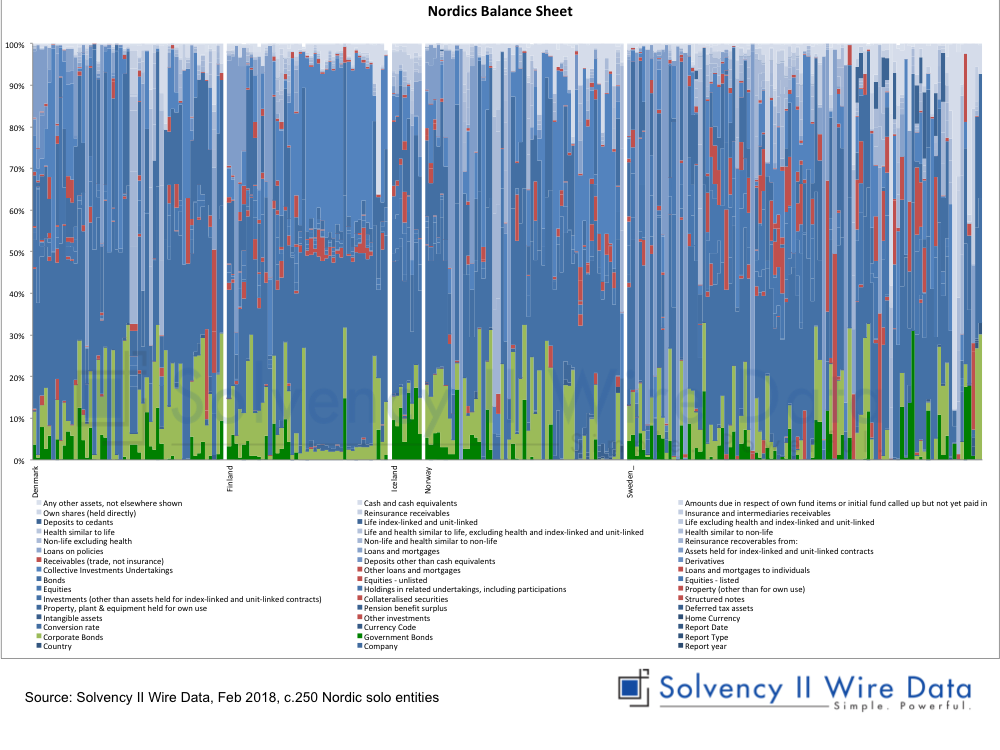
For each country (separated by a white bar), the firms are organised in descending order by total assets (from left to right).
The data shows that allocation to alternatives is not directly correlated with the size of the balance sheet. In fact, in a number of markets, notably Finland and Sweden, there is a concentration of alternative assets amongst the medium and smaller firms.
—
Full details of individual companies are available to premium subscribers of Solvency II Wire Data.
![]()
[agileform id=”5749563331706880″]