The chart shows the Solvency Margin Ratio (SMR) of Japanese insurance groups at the end of the fiscal year 2024. The ratios are calculated by dividing the Total amount of Solvency Margin by half of the Total Amount of Risk.
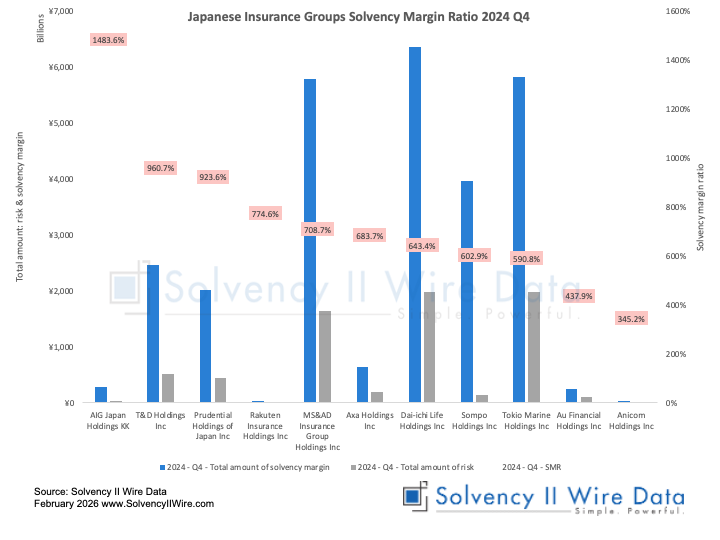
The chart shows the Solvency Margin Ratio (SMR) of Japanese insurance groups at the end of the fiscal year 2024. The ratios are calculated by dividing the Total amount of Solvency Margin by half of the Total Amount of Risk.