Analysis of the SCR ratio of over 2,200 solo European insurers reveals a trend towards strengthening of insurers capital.
The historgram below shows distribution of SCR ratios (100% intervals) between 2016 and 2017.
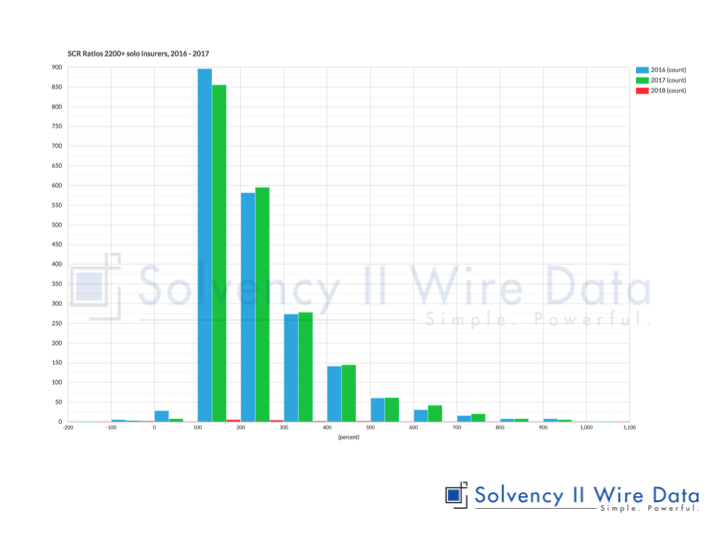
For all the lower ranges -100% to 199% the number of companies has decreased.
At the same time almost all of the ranges above 200% demosntrate an increase in number of firms, indicating an overall strengthening of the capital across the market.
The finding are supported by EIOPA figures (also available on Solvency II Wire Data), which show that the average SCR ratios for the EEA rose from 228% in 2016 to 239% in 2017.
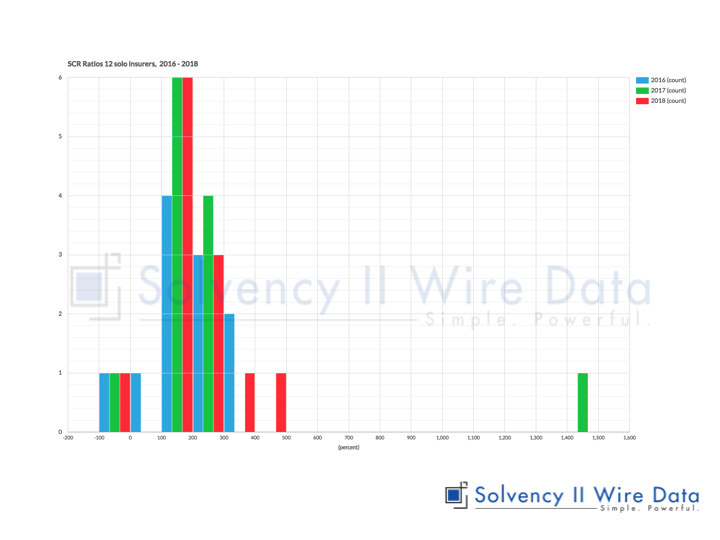
The chart below shows the ratio distribution of 12 insurers reporting their 2018 Solvency II public disclsoures ahead of the market.
Our Solvency II Wire Data database gives you unparalleled access to the Solvency II public disclosures.
Click here to find out more details or request a demo.

]]>