ANALYSIS
 The Solvency II Quantitative Reporting Templates (QRTs) hold a wealth of data about the European insurance industry, which is now available to be mined for the first time. The publicly disclosed solo QRTs have about 1,700 cells. The average report contains about 200-300 cells with data. Several insurers have also been voluntarily publishing a private version of these QRTs, which are filed with the regulator, and contains additional data.
The potential of this data-mine of the insurance industry is only now beginning to be realised. Dick Rae, Director, Insurance Solutions at BMO Global Asset Management (EMEA), examines some of the insights asset managers can glean from the disclosures.
The Solvency II Quantitative Reporting Templates (QRTs) hold a wealth of data about the European insurance industry, which is now available to be mined for the first time. The publicly disclosed solo QRTs have about 1,700 cells. The average report contains about 200-300 cells with data. Several insurers have also been voluntarily publishing a private version of these QRTs, which are filed with the regulator, and contains additional data.
The potential of this data-mine of the insurance industry is only now beginning to be realised. Dick Rae, Director, Insurance Solutions at BMO Global Asset Management (EMEA), examines some of the insights asset managers can glean from the disclosures.
Introduction
In the UK, the Solvency II reporting regime doesn’t bless us with the richness of understanding that we were used to under Solvency I and the PRA returns, but it does allow easier analysis at a higher level and comparison across Europe. Using analysis of UK insures, this article will show how the disclosures can be used to gain a better understanding of the makeup of insurers’ own funds. Before diving into the detail of how the money was invested, let us first explore UK insurer’s exposure to market risk relative to their other risks. The graphs below show the market risk as a percentage of the total risk (vertical axis) plotted against the amount of diversification benefit (horizontal axis) for each company. [caption id="attachment_1587765" align="alignnone" width="933"]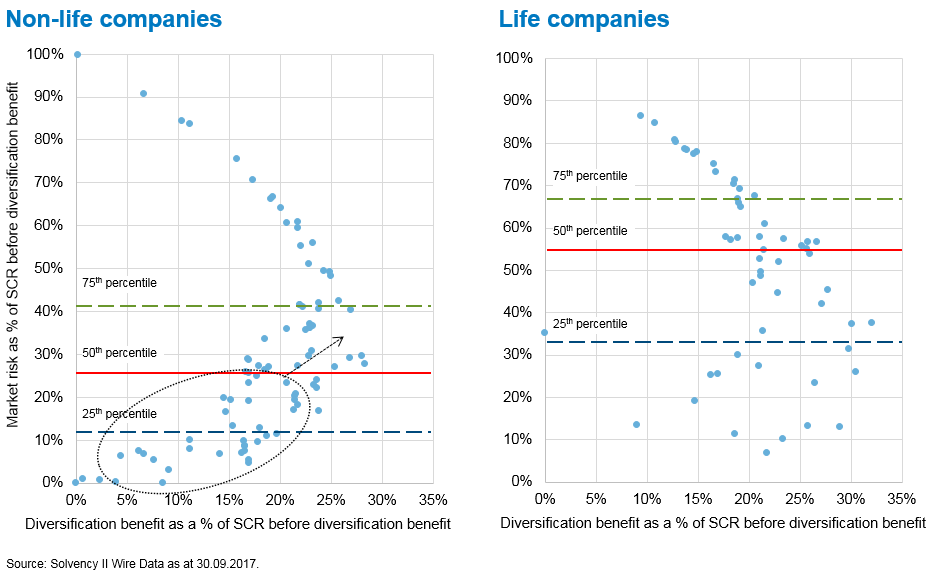 Figure 1: Market risk as a percentage of total risk against diversification benefit for UK insurers,SOURCE: Solvency II Wire Data as at 30.09.2017 and BMO Global Asset Management calculations.[/caption]
Unsurprisingly, exposure to market risk is lower for non-life insurers. However, the graph illustrates how there is an opportunity for non-life insurers to gain more diversification benefit by increasing exposure to market risk. What this suggests is that if an insurer can become comfortable with additional market risk it has the potential to achieve this in a very capital efficient way.
The additional market risk could be thought of as adding a new line of business. The same holds true for a good number of life insurers too.
Figure 1: Market risk as a percentage of total risk against diversification benefit for UK insurers,SOURCE: Solvency II Wire Data as at 30.09.2017 and BMO Global Asset Management calculations.[/caption]
Unsurprisingly, exposure to market risk is lower for non-life insurers. However, the graph illustrates how there is an opportunity for non-life insurers to gain more diversification benefit by increasing exposure to market risk. What this suggests is that if an insurer can become comfortable with additional market risk it has the potential to achieve this in a very capital efficient way.
The additional market risk could be thought of as adding a new line of business. The same holds true for a good number of life insurers too.
Company analysis
The big holders of assets are of course the life insurers, at £2 trillion of assets … To access Premium subscriber content click here …Non-life insurers investment – own funds
The universe of non-life insurers provides an uncomplicated and reasonably homogenous set of balance sheets, which can be used to observe how this group of insurers invest their own funds. In doing this, we have assumed a “matching hierarchy” in which ’other assets’ as shown in the diagram above serve first to pay ’other liabilities’ and then claims. We then assume that any remaining liabilities are matched with corporate bonds, then government bonds etc. From this we have derived a set of assets backing own funds (Solvency II broadly defines own funds as the capital a firm has available to meet any unexpected claims and so remain solvent). The diagram below shows the distribution of the asset allocation across the asset classes provided in the disclosures. As expected, there is a significant allocation to deposits and cash equivalents to meet unexpected claims followed by a range of assets that some insurers invest in to obtain additional returns. [caption id="attachment_1587769" align="aligncenter" width="1381"]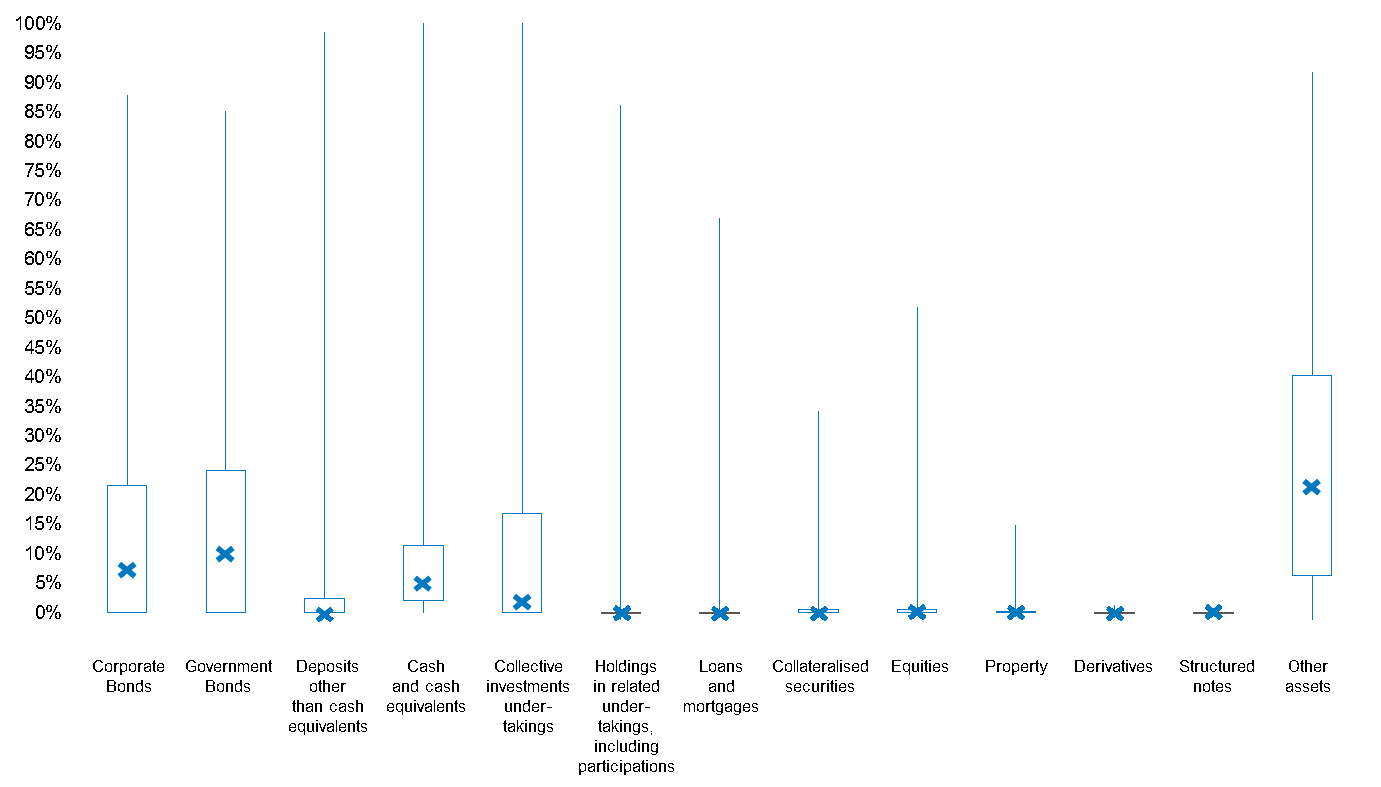 Figure 4: range of asset allocation showing highest, lowest and the 25th, 50th, 75th percentiles for UK non-life companies, SOURCE: Solvency II Wire Data as at 30.09.2017 and BMO Global Asset Management calculations[/caption]
Life insurers – own funds
In contrast life companies have a far greater set of heterogeneous liabilities that drive asset allocation, therefore, separating assets backing liabilities from assets backing own funds makes less sense. Here, we have reduced the best estimate liability by those assets backing unit-linked liabilities and excluded these from the asset portfolio. Looking at the asset allocation backing both the technical provisions and own funds. The average balance sheet for a UK life insurer is shown in Figure 5 and an asset allocation for own funds as shown in Figure 6. [caption id="attachment_1587770" align="aligncenter" width="941"]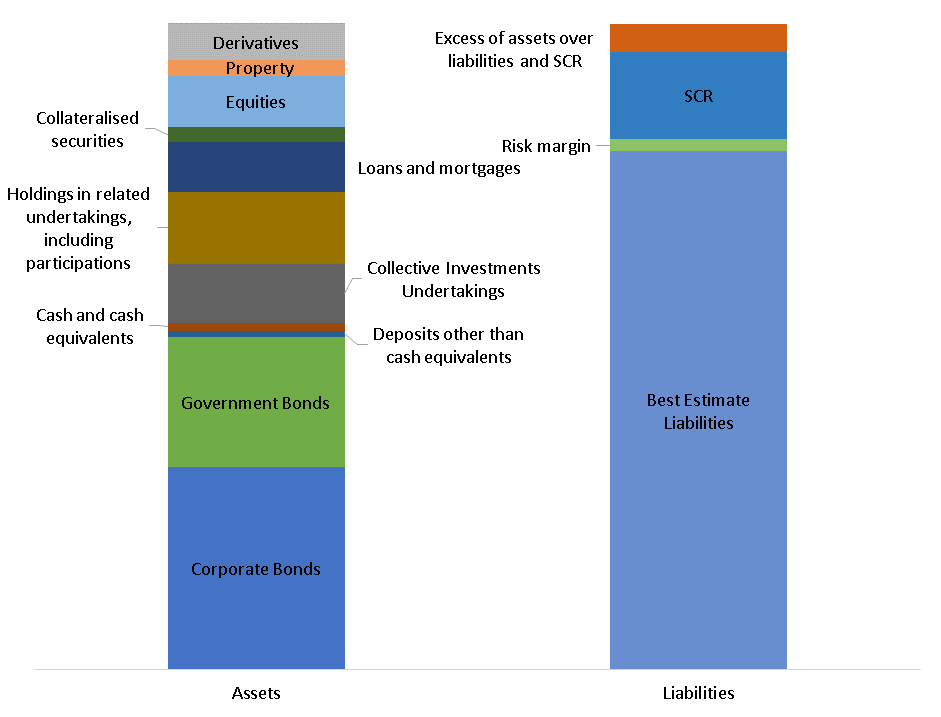 Figure 5: The average breakdown of a UK life insurer’s balance sheet, SOURCE: Solvency II Wire Data as at 30.09.2017 and BMO Global Asset Management calculations[/caption]
These show, on average, roughly equal weightings to equities and government bonds, but unlike non-life companies there is a far greater variance in the allocation to corporate bonds compared to investments in government bonds suggesting a far wider range of investment appetite amongst life insurers.
[caption id="attachment_1587771" align="aligncenter" width="1502"]
Figure 5: The average breakdown of a UK life insurer’s balance sheet, SOURCE: Solvency II Wire Data as at 30.09.2017 and BMO Global Asset Management calculations[/caption]
These show, on average, roughly equal weightings to equities and government bonds, but unlike non-life companies there is a far greater variance in the allocation to corporate bonds compared to investments in government bonds suggesting a far wider range of investment appetite amongst life insurers.
[caption id="attachment_1587771" align="aligncenter" width="1502"]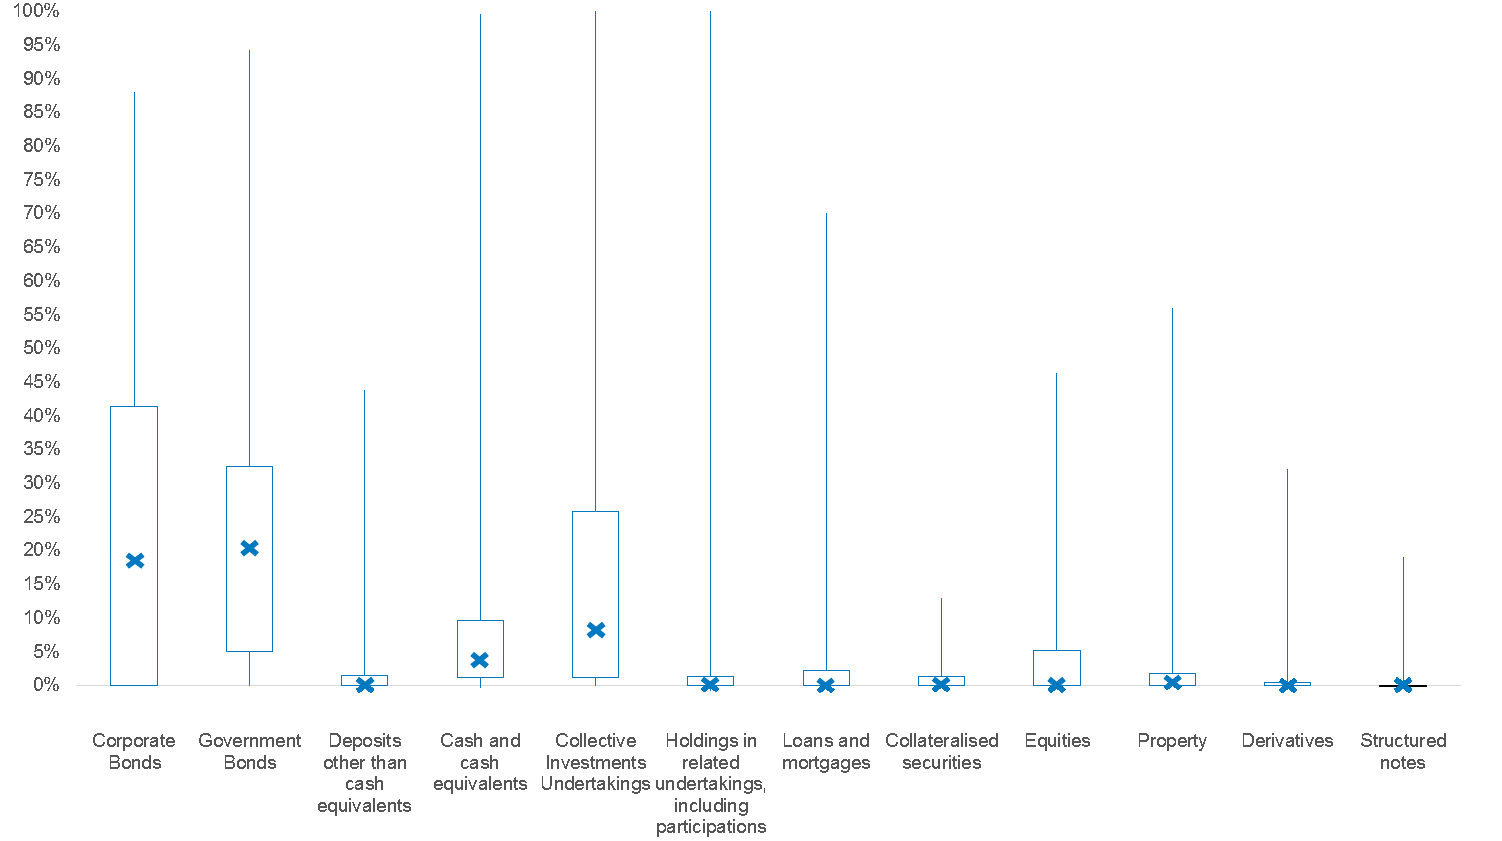 Figure 6: range of asset allocation showing highest, lowest and the 25th, 50th, 75th percentiles for UK life companies, SOURCE: Solvency II Wire Data as at 30.09.2017 and BMO Global Asset Management calculations[/caption]
There is a healthy allocation to collective investment undertakings (CIU), which could be an allocation to hedge funds and other investment strategies or it could be to more vanilla equity and corporate bond portfolios. Outside of CIU, it can be seen that the allocation to equities has overall fallen from favour, suggesting a prevailing view that equities’ volatility characteristics and capital requirements make this asset class relatively unattractive.
Figure 6: range of asset allocation showing highest, lowest and the 25th, 50th, 75th percentiles for UK life companies, SOURCE: Solvency II Wire Data as at 30.09.2017 and BMO Global Asset Management calculations[/caption]
There is a healthy allocation to collective investment undertakings (CIU), which could be an allocation to hedge funds and other investment strategies or it could be to more vanilla equity and corporate bond portfolios. Outside of CIU, it can be seen that the allocation to equities has overall fallen from favour, suggesting a prevailing view that equities’ volatility characteristics and capital requirements make this asset class relatively unattractive.
First insights
The most interesting aspect of the Solvency II disclosures is the insight we get, for the first time, of the split between market risk and underwriting risk. It is also about what the analysis does not show as much as what it does. We found no strong evidence on the non-life side that financially strong companies invested in their own funds more aggressively than those less strong companies. On the life side we could see a bias towards illiquid assets of the annuity writers and the differing preferences of insurers between a number of fixed income asset classes. We also noticed an array of peak exposures, of various asset classes, taken by a minority of insurers. For some this relates to the peculiarities of their balance sheet, for others it is a willingness to differentiate themselves from their peers through their asset allocation strategy. This year is just a snap shot. Next year we will be able to see how insurers have changed their behaviour to meet the continuing challenge to hunt out additional returns within the Solvency II framework. — The author is Director, Insurance Solutions at BMO Global Asset Management (EMEA). Views expressed are the author’s own. Find out more about Solvency II Wire Data and the information available to premium subscribers here: Solvency II Wire Data. ]]>
]]>