ANALYSIS
Analysis of the largest European insurance groups finds that many publish Solvency II SCR ratios in their headline disclosed to investors that deviate from the ratios in the QRTs.
The analysis was published in a research note by KBW European Insurance using company disclosures, and Solvency II figures from Solvency II Wire Data. It compares the 2017 year-end investor disclosures of 39 European insurance groups with the Solvency II public disclosures in the QRTs.
While on average the ratios for the entire sample were nearly identical (just over 200%) only 13 of 39 firms examined published identical Solvency II ratios. The chart below plots the ratio in the QRTs (y axis) against the headline ratio (x axis) showing the differences. The deviations are driven by a number of factors, including reporting under a third country regime, timing or rounding, or deliberate deviation.
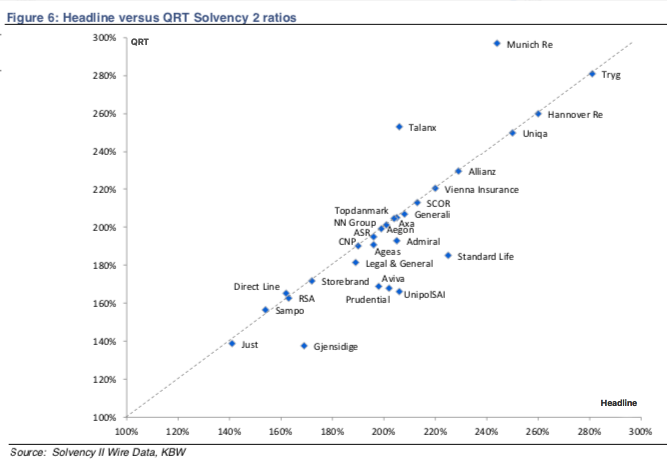
For example, Gjensidige the Norwegian insurer reported a higher headline ratio by a factor of 1.23 (169% headline vs. 137% in the QRTs). The Gjensidige annual report explains that the insurance entities of the group received approval to use a partial internal model after the balance sheet date. The company chose to focus on the target headline in their disclosures to investors, stating: “Based on the approved Partial Internal Model, the regulatory Solvency II ratio is estimated to be 145-155 per cent.”
‘Shareholder view’ and the Solvency II ratio
According to the KBW research, one of the most common forms of deliberate deviation from the QRT figures is used by UK life companies, which apply a ‘shareholder view’ of the Solvency II ratio. The report states: “In simple terms, this removes the Solvency Capital Requirement (SCR) of with profits business (or more broadly “ring-fenced funds”) and any own pensions in surplus from available and required capital.”
For example, the headline Solvency II ratio for Aviva is 198% compared with 169% in the QRTs. In the Aviva annual report the company explained that the shareholder view excludes fully ring fenced with-profits funds and staff pension schemes in surplus of GBP 1.5 billion.
The Aviva report also details other adjustments to the ratio such as pro forma impacts of the disposals of various companies and impact change in the treatment of some transitional provisions.
Similarly Standard Life reported a headline Solvency II ratio of 225% compared with 185% in the QRTs. Its annual report includes a detailed reconciliation of the differences between the two figures. The authors of the KBW report explain that the ‘shareholder view’ is used by the UK industry because elements such as the with-profits business are enclosed in a separate legal entity from the group and the excess capital in that entity is at the shareholders’ disposal.
KBW argues that while the adjustment is neutral to the surplus capital (because an equal reduction is made to both required and available capital) it does increase the Solvency II headline ratio “and would also introduce a distortion for any analysis that is based on a multiple of SCR for cushioning.”
Ongoing differences in ratios of European insures
Further differences between the two ratios were found in a number of other non-UK groups too. The analysis found that both Munich Re and Talanx published higher SCR ratios compared to the QRTs.
According to the report: “As a result of industry solidarity and life subsidiary tactical capital management, these German groups apply full transitional benefit for low yield risk in their official QRT filings but strip this out in their own view of risk they provide shareholders.” The deviations in the Solvency II SCR ratios between the headline view and the QRTs will remain.
Over time, users of the data are likely to build these deviations into their analysis and interpretation. The fact that Solvency II provides standardised constants can help to benchmark or calibrate that view and help improve the understanding of insurance companies.
Solvency 2: Making use of QRTs is available for KBW’s clients and industry contacts. For further information, please email: whawkins[at]kbw[dot]com.
The full set of Solvency II data used for the research is available to Solvency II Wire Data premium subcribers.