![]()
ANALYSIS
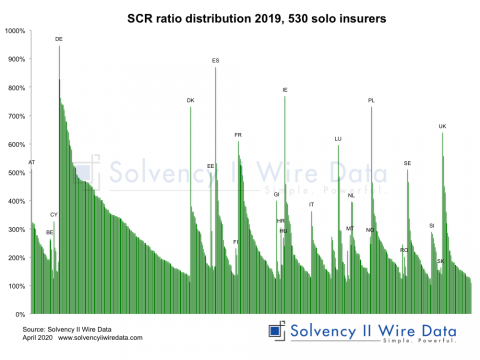
Much has been made of the importance of the Solvency II coverage ratio and the risk of breaching the 100% mark. Those breaching their SCR ratio face a twofold challenge: managing regulatory intervention and stakeholder reaction to the breach. The latter may also apply to firms with very low ratios. Analysis of 1,600 solo firms collected and processed by Solvency II Wire Data reveals that 21 firms breached their SCR ratio as of 31 December 2016. Raising the threshold to 120% shows that there are 99 insurers with a ratio close to, or breaching, the limit. 99 insurers sailing close to the wind.
The sample in detail
The geographic spread of the sample is dotted across Europe with pockets concentrated in the UK (20 firms), Italy (12 firms), Gibraltar (12 firms) and France (10 firms). Gibraltar stand out in that 12 out of 28 firms reviewed have an SCR ratio below 120%. The average SCR ratio for all 28 firms is 183% and average MCR ratio is 306%.
No usual suspects
The majority of the firms in the sample (62 firms) are non-life insurers. Only 5 firms use either an internal model or partial internal model. Throughout the sample 30 firms apply a total of 40 LTG measures (a number of firms use more than one measure). The Volatility Adjustment is used by 25 firms, 12 use some form of transitional and only 3 firms use the Matching Adjustment. The figures are in keeping with the popularity of the Volatility Adjustment across Europe.
Close to the edge
Of the 99 firms in the sample, 21 firms breached their SCR ratio. 10 firms also breached their MCR ratio. 4 firms have a negative SCR and MCR ratio (20 firms in total), which is due to having negative own funds. The MCR ratio for the sample ranges from -263% (Municipal Mutual Insurance Limited, UK) to 477% (La Rurale, FR).
Asset allocation
The asset portfolio of the sample is dominated by government and corporate bonds as can be observed from the chart below. It is interesting to note that about 10% of the firms in the sample hold no bonds in the portfolio (see the group of firms concentrated to the right of the chart). [gview file=”https://www.solvencyiiwire.com/wp-content/uploads/2017/10/Asset-allocation.pdf”]
Overall, the sample is well capitalized with the majority of firms holding 100% Tier 1 unrestricted capital (see chart below).
[gview file=”https://www.solvencyiiwire.com/wp-content/uploads/2017/10/Tier-capital.pdf”]
However, about a quarter of the firms make more extensive use of tier 2 and tier 3 capital, with some (at the right end of the chart) appearing to make full use of their tier capital allowance.
The 4 firms with negative ratios have negative tier capital, which is generating the negative ratios.
For the 94 firms using the standard formula (see chart below), the largest risk component is Market Risk (red bars) and Non-life underwriting risk (light green bars).
[gview file=”https://www.solvencyiiwire.com/wp-content/uploads/2017/10/SCR-Components.pdf”]
Asset distribution comparison
The following 4 pairs of charts compare the asset allocation of a specific asset class of the sample with that of the top 400 firms that have an SCR ratio of 300% or …
PREMIUM SUBSCRIBER CONTENT for further details click here
…
Conclusion
The 1,600 firms examined in this analysis represent close to half of all Solvency II firms in Europe (the estimated market total is in the region of 3,355 see Solvency II Wire 2/10/2017). The 99 firms represent about 6% of these. Assuming this proportion is maintained for the full data set it may indicate that close to 10% of firms across Europe have an SCR coverage ratio of 120% or less.
 ]]>
]]>